
Most HR dashboards are good at answering the questions they were built to answer. The challenge arrives when someone asks the next one.
Which of my staff are projected to exceed the 60-day annual-leave carry-over cap? Of those, who has no leave booked before the 31 March cut-off? Which departments are most exposed? Who needs a nudge to book leave before the 31 March cap, or they will lose days permanently?
These are practical management questions, but answering them often requires combining balances, future bookings, dates, absence types, employment status, and departments under governed HR rules, all within each institute’s secured slice of the data. If the required view is not already available in a dashboard, it becomes a report request. Someone must write a query, prepare the analysis, validate the result, and send it back. By the time the answer arrives, the moment for a timely intervention may already have passed.
Lattice-HR is designed to close that gap. It is a secure, web-based analytics platform for HR leave, absence, mission, balance, and workforce data. It combines a fixed dashboard for recurring HR indicators with a conversational analytics interface for the questions that were not anticipated when the dashboard was built. Each HR focal point sees only their own institute’s data; the questions above illustrate what any one focal point might ask within their own scope.
Built on Lattice, a reusable intelligence layer
Lattice-HR is one application built on top of Lattice, a reusable agentic intelligence layer developed at UNU.
Lattice is not application-specific. It is an agent harness that brings together interchangeable AI models, sandboxed analysis tools, and governed institutional data sources in a continuous agentic loop.
When a question is asked, the assistant:
- Reasons about what information and analysis are needed.
- Acts by querying relevant data or generating and running analysis code.
- Observes the results.
- Refines its approach until the answer is grounded in the underlying records.
If something goes wrong, the assistant can read the error, adjust its approach, and try again rather than simply returning a failed result.
Because Lattice is an intelligence layer rather than a fixed product, the same governed analytical loop can be applied to other institutional datasets and applications. Lattice-HR applies this capability to HR data at UNU, with access, tools, business rules, and data scope configured for that specific context.
Dashboards solve the known-question problem
Power BI remains an effective platform for governed reporting. It is particularly well suited to recurring reports with approved definitions, executive dashboards with a consistent layout, standardized key performance indicators, and pixel-perfect management and statutory reporting.
These are important strengths. A monthly HR pack should not change its structure every time it is opened. Leaders need stable indicators that can be compared consistently over time.
The limitation is structural rather than a weakness in the product. A dashboard is necessarily finite. It contains the pages, filters, visualizations, and calculations that someone decided to build in advance. Filters and slicers help, but they operate within a pre-built view. Once a question requires combining two separate ideas, a new chart type, or a calculation that no existing page supports, a report author must usually create another view. A custom web dashboard carries the same constraint.
The real difference comes from adding a conversational analytics plane that can generate a new result when the question is asked.
In fairness, Power BI also has Copilot
It would be misleading to describe the choice simply as “dashboard versus chat.” Copilot for Power BI already provides conversational and generative capabilities across report consumption and report development. It can support on-the-fly analysis, help create report content, and assist advanced users with Data Analysis Expressions, or DAX. Microsoft also offers standalone and application-level Copilot experiences, although some of these remain in preview. Microsoft’s Copilot for Power BI overview describes these capabilities in detail.
The primary practical difference for UNU is licensing. Copilot for Power BI requires a minimum of paid Fabric capacity at F2, and higher capacity tiers are needed as the number of concurrent users grows. This Fabric capacity is a fixed infrastructure commitment: the cost is incurred whether Copilot is actively used or not. On top of that, Copilot usage itself draws on Fabric Copilot capacity, which is billed separately. Free SKUs and trial capacities are not supported.
Lattice-HR requires neither a Fabric capacity commitment nor a per-seat BI license. Access is a browser and an organizational single sign-on. There is inference cost from the underlying language model, but it is on-demand: you pay only when the assistant is actively used, with no standing capacity commitment. Lattice-HR is also model-agnostic: it works with open-source models hosted on Azure Foundry or run locally, which typically cost a fraction of frontier model rates, and for structured HR analytics against a well-defined dataset, they are generally sufficient.
Lattice-HR is also built around a specific set of design choices:
- The same business rules govern both the dashboard and the chat, so the two surfaces cannot produce different answers for the same question.
- Generated analyses can be saved, replayed, and published as shared queries for consistent use across institutes.
- The model can be self-hosted or accessed through an approved enterprise service.
The four sections after the business case explain how these work in practice.
The questions that become report requests
Some questions can be answered by adjusting a filter or slicer in an existing view. The questions below cannot, because each requires combining two separate ideas into a single result, generating a visualization that was not designed in advance, or crossing dimensions that no single dashboard page covers. Today, each tends to become a report request. With Lattice-HR, each can be asked in plain language and returns an answer, a table, or a generated chart that can be refined, saved, and replayed.
Leave balances and utilization
- Who has not taken annual leave in the last six months but still has a balance above 40 days?
- How does leave utilization in the third quarter compare with the same period last year, broken down by institute and department?
Forfeiture risk
- Who is projected to exceed the carry-over cap, and of those, who has no leave booked before 31 March?
- Of those at risk, how many already have leave booked before the cut-off, and who are they?
This moves the analysis beyond a list of at-risk staff. It helps HR focal points identify who genuinely needs a reminder and who has already planned leave, a meaningful distinction before any intervention.
Missions and travel
- How many mission days did each institute record this year, and is that up or down on last year?
- How do mission days compare with annual-leave days for researchers?
Wellbeing and duty of care
- Who has both high mission travel and low annual-leave utilization over the last 12 months, and can we see that as a chart?
This should be read as a prompt for a supportive check-in, not as an assessment of employee performance, health, or personal circumstances. The application can identify a pattern in the data. It should not infer why that pattern exists.
Coverage and workforce planning
- Which two-week window next quarter has the most people away, and which institutes and departments are most affected?
Training compliance and contracts
Because Lattice-HR is connected to the UNU global directory, it can also answer questions that cross the boundary between leave data and workforce data:
- Which staff members have not completed mandatory training and whose contracts are expiring within the next three months?
- Which contracts are due for renewal before the end of the quarter, and are those staff members currently on leave or mission?
- Who in my institute has outstanding training compliance requirements?
These questions combine data from two sources that are rarely available in the same analytical environment, and they are exactly the kind of question that tends to fall between systems today.
The result itself can be visual. The assistant generates the chart or table on demand within the conversation, and any useful result can be refined, saved, and replayed. The figure below shows a live session in which the assistant was asked to perform a forfeiture projection for active FTA and PSA staff from multiple angles. It independently sequenced the analysis from institute-level totals to projected balance distribution, narrating its own reasoning between charts.
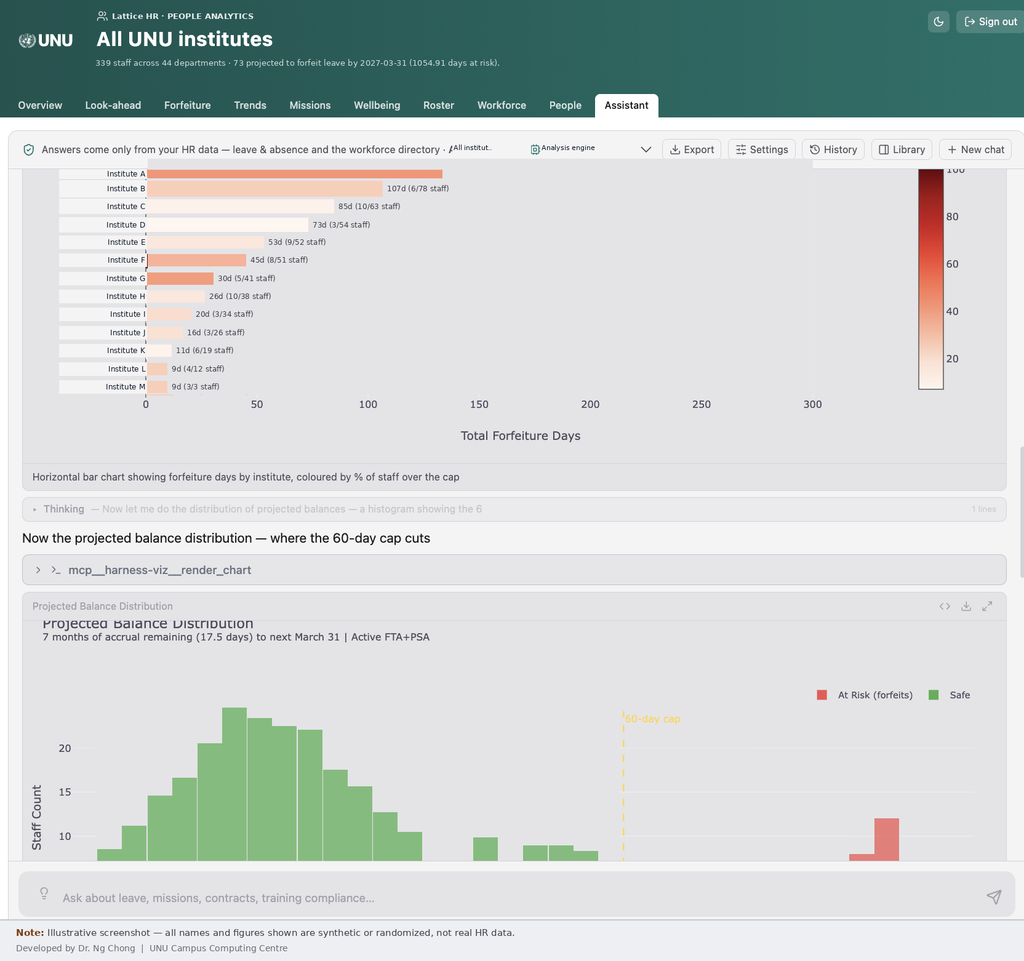
Figure: Lattice-HR Assistant session showing a forfeiture projection analysis for active FTA and PSA staff. The assistant sequenced the analysis unprompted, moving from total forfeiture days by institute, colored by the proportion of staff over the cap, to a projected balance distribution showing where the 60-day cap cuts across the population. The “Thinking” indicator shows the assistant narrating its own next step before executing it.
All figures use anonymized and randomized data. Headcounts, balances, percentages, and chart values are illustrative only and do not reflect actual organizational data.
The business case
Lattice-HR pairs its dashboard with a chat-based assistant that answers plain-language questions against the same governed data. Here is why that combination is worth building.
Faster access to answers
Questions that previously required a report request can now be answered while the issue is still relevant. This is especially valuable for leave forfeiture reminders, coverage planning, duty-of-care reviews, training compliance checks, and contract renewal oversight. The goal is not to produce a report faster. It is to make the analysis available at the moment a decision or intervention is useful.
Lower cost for new views
Chat lowers the cost, in time and effort, of creating an exploratory view, because the initial analysis is generated from a plain-language question rather than built as a chart. Many questions are temporary or relevant only to a single management discussion, so answering them without permanently expanding the dashboard is valuable in its own right. If an analysis proves useful repeatedly, it can be saved and replayed. If it becomes an official indicator, it can be promoted to a governed dashboard view.
More effective self-service
Chat lowers the threshold for self-service. HR focal points can ask questions in operational language while the application applies the governed data definitions underneath, without needing to know how accrual is calculated, how date ranges should be filtered, or how to build a chart.
Focus, exploration, and closer inspection
A dashboard is well suited to open, visual exploration. Multiple charts are visible at once, patterns catch the eye across views, and you can survey the landscape without first needing to articulate a specific question. That kind of ambient scanning is genuinely valuable, and the fixed dashboard in Lattice-HR is designed for exactly that.
But exploration by dashboard becomes constraining once you have identified a concern and want to follow it. The next step is determined by what page someone designed months earlier. If the chart that caught your attention does not have the right slice, or the question that follows cannot be answered by an existing filter, you have reached the boundary of what the dashboard can do.
Chat is better suited to that second mode: pursuing a specific concern to a useful conclusion. You arrive with a question and receive a focused answer without needing to interpret several charts at once. If the result suggests a natural follow-up, the assistant can continue the analysis in the same conversation.
For example, a user might ask, “Which two-week period next quarter has the highest number of staff away?” If the answer identifies a particular period, the user can follow with, “Which departments are most affected?” and then, “Which absences overlap during those dates?” If leave-request approval status is available in the connected data, the user could also ask whether pending requests would increase the number of staff away. The analytical thread continues without requiring a separate report.
Chat also supports a related use: closer examination of the records behind a dashboard. If a chart reveals missing balances, an unexpected count, or overlapping absence entries, the user can inspect the affected records and ask whether the pattern is associated with incomplete fields, possible duplicates, inconsistent classifications, or another observable data condition.
For example, if a coverage chart shows staff recorded as being on annual leave and mission during overlapping dates, the assistant can identify the relevant entries and compare their dates and classifications. It can flag possible duplicate or inconsistent records for review, but it should not claim to know why the overlap occurred unless the underlying data provides supporting evidence.
This makes conversational analytics useful not only for answering management questions, but also for identifying and investigating potential data-quality issues.
The two modes complement each other directly. The dashboard surfaces the concern. The chat resolves it.
Consistent calculations across dashboard and chat
A conversational interface is only useful if it applies the same definitions and calculations as the dashboard beside it. Lattice-HR therefore implements governed HR rules once and uses the same calculation layer across both interfaces.
Date-range overlap provides a practical example. A leave period may begin before a reporting window but continue into it. Filtering only on the start date would omit an absence already in progress.
During testing, start-date filtering produced a materially larger group of staff who appeared to have no leave booked. The correct overlap calculation showed that some were already on leave or had leave scheduled within the period. Without the corrected logic, those staff members could have been contacted unnecessarily.
The overlap calculation is implemented in a shared module used by both the dashboard and conversational interface. This reduces the risk of different interpretations of the same rule and helps keep ad hoc answers consistent with governed reporting.
Actionable explanations
Beyond the figure, the assistant summarizes what it means and can suggest follow-up actions, distinguishing between staff at forfeiture risk who already have leave planned and those who appear to have nothing booked. The explanation is grounded in the data.
No separate BI license for users
Lattice-HR is accessed through a modern web browser and organizational single sign-on. No desktop authoring application or per-user BI license is required. Infrastructure and model-compute costs exist but are managed as part of the application architecture.
Governed: one set of rules, one set of answers
Lattice-HR answers only from designated datasets, applies the same tested calculations across dashboard and chat, and denies access when institute mappings are not configured. Answers identify the effective date of the data, while analytical tools run in an institute-scoped environment without web browsing or general internet access. Models operate locally or through an approved enterprise service.
Scoped: institute boundaries at the data layer
Each HR focal point receives access only to records for the respective institute. This boundary is implemented in the data supplied to the session; another institute’s rows are simply not present and cannot be retrieved through a prompt.
This treats institute scoping as a physical data boundary rather than a presentation preference. A filter can be bypassed or misconfigured. Data that is not in the session cannot be retrieved, regardless of how a question is phrased.
Reused: saved analyses that replay and self-heal
A conversational result should not disappear when the chat ends. Useful analyses can be saved to a personal or institute-level library and refreshed in two ways.
Replay re-executes the validated analysis code against the latest dataset without a language-model call. It is fast, deterministic, and costs no model tokens. This is the right option when the dataset structure and business question are unchanged: for example, running last month’s forfeiture-risk shortlist against this month’s data.
Smart Replay is used when the saved analysis can no longer run as written, for example because a field has been renamed or the data structure has changed. The assistant inspects the failure, adapts the code, runs it again, and explains the refreshed result. This self-correcting loop, now built into the agentic chat interface, was developed specifically so that models, including locally hosted ones, can handle execution errors without returning a failed analysis to the user.
The practical workflow is: ask, examine, refine, validate, save, replay, using Smart Replay only when the data has shifted enough to break the saved code. A one-off question can therefore become a reusable analytical asset without entering a report-development backlog, and routine refreshes consume no model compute.
Extended: session exports and an HQ-published shared library
Exportable analyses and session records. HR focal points can export analyses and full session records for reporting, audit, or management review.
HQ-published queries, visualizations, and prompts. The HQ HR team can author a saved query, visualization, or suggested prompt once and publish it to the Lattice-HR shared library. Institute focal points see it alongside their own saved analyses and can run it at any time. When they do, it executes against their own institute-scoped data only. No data moves between institutes; what is shared is the analytical logic, not the result.
This means HQ can ensure that a particular analysis, a forfeiture check, a mission-versus-leave comparison, or a coverage look-ahead, is run consistently across all institutes without each focal point building it independently. It is an extension of the fixed dashboard, delivered through the same governed environment.
The broader opportunity
Dashboards remain essential. They provide stability, comparability, and confidence for the questions an organization asks repeatedly.
But no dashboard can anticipate every combination of workforce group, organizational unit, time period, balance, absence type, and management concern. Filters can extend a dashboard, but they still operate within views and calculations designed in advance.
Lattice-HR combines a dependable dashboard for known questions with a governed conversational layer for the questions that emerge in practice.
The challenge Lattice-HR addresses is not unique to UNU. Any organization managing leave, travel, compliance, contracts, and other workforce information will recognize the gap between what a dashboard presents and what someone needs to understand at a particular moment.
Conversational analytics does not replace trusted reporting. It extends it, making governed data useful for a much wider range of questions.